
Recruiter Profitability Scorecards: Metrics, Reporting, and Incentives to Boost Staffing Firm Margins
Revenue can grow while recruiter profitability stays unclear.
That is a common problem in staffing and recruiting firms. Owners often know who is “busy.” They may know who is making placements. They may even know who is bringing in the most revenue.
But revenue alone does not show whether each recruiter is helping the firm become more profitable, more predictable, and easier to manage.
This article explains what a recruiter profitability scorecard is, which metrics matter most, and how staffing firms can use better reporting and incentive structures to improve margins without creating the wrong behavior.
What a Recruiter Profitability Scorecard Is
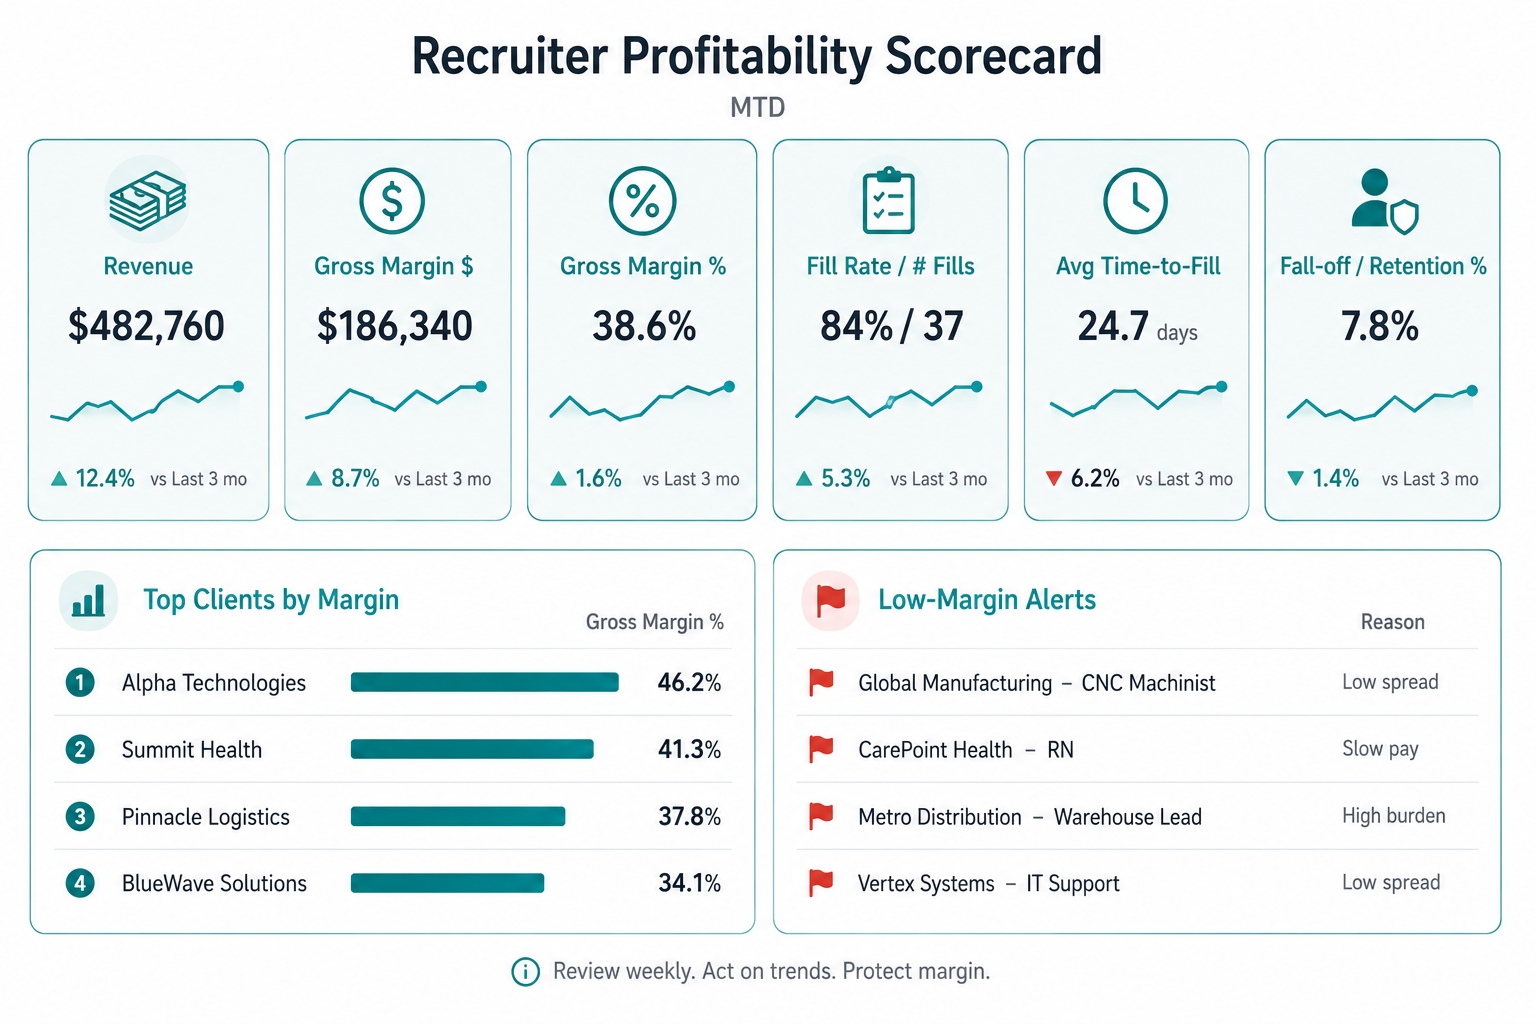
A recruiter profitability scorecard is a simple reporting tool that connects recruiter activity to financial outcomes.
It helps answer questions like:
Which recruiters are generating profitable revenue?
Which clients or roles are creating the most margin?
Where are placements happening, but profit is not improving?
Which recruiters need coaching, better job orders, or clearer targets?
The goal is not to micromanage recruiters.
The goal is to give owners and managers better visibility into how recruiter performance affects margin, cash flow, and firm profitability.
A useful scorecard should connect three areas:
Activity
Production
Profitability
Most firms track the first two. Fewer firms track the third well.
Why Revenue Alone Is Not Enough
Revenue is easy to understand, but it can be misleading.
A recruiter who produces high revenue may still be creating margin pressure if:
Bill rates are too low
Pay rates are too high
Client terms are weak
Fill speed is slow
Client payment behavior is poor
Placements require too much internal support
On the other hand, a recruiter with lower total revenue may be highly valuable if they consistently produce strong-margin placements with reliable clients.
That is why recruiter reporting should not stop at sales or placements.
A staffing firm needs to understand the quality of the revenue being produced.
Core Metrics to Include in a Recruiter Scorecard
A recruiter profitability scorecard does not need to be complicated. The best ones are usually simple, consistent, and reviewed regularly.
Here are the core metrics to consider.
Revenue by Recruiter
This is the starting point.
Revenue by recruiter shows the total billing or placement revenue tied to each recruiter during a period.
For temporary staffing, this may include weekly gross billings.
For direct hire or recruiting firms, this may include placement fees.
Revenue is useful because it shows production volume. But it should not be treated as the final measure of performance.
Revenue answers:
How much business did this recruiter produce?
It does not answer:
Was that business profitable?
Gross Margin by Recruiter
Gross margin by recruiter is one of the most important metrics in the scorecard.
At a basic level, gross margin is:
Revenue minus direct labor costs
For staffing firms, this typically includes:
Wages paid to placed employees
Employer payroll taxes
Workers’ comp costs
Benefits tied directly to employees
Other direct burden costs
Gross margin by recruiter helps show whether a recruiter is producing revenue that leaves enough money to support the firm.
Two recruiters can produce the same revenue but very different gross margin.
That difference matters.
Gross Margin Percentage
Gross margin dollars show the amount of margin produced.
Gross margin percentage shows the quality of that revenue.
For example, a recruiter may generate strong total revenue but at a low margin percentage. That may be acceptable in some cases, especially with large, stable clients. But it should be visible.
Gross margin percentage helps identify:
Pricing discipline
Client quality
Role profitability
Pay rate vs bill rate issues
Margin pressure before it becomes a firm-wide problem
This metric is especially useful when comparing recruiters who work on different types of clients or roles.
Spread or Markup by Placement
For temporary staffing, the spread between pay rate and bill rate is critical.
A scorecard should show whether recruiters are consistently placing candidates at rates that support the target margin.
This can include:
Average pay rate
Average bill rate
Average spread
Average markup
Average gross margin percentage
The point is not to punish recruiters for every low-margin placement. Some low-margin work may be strategic.
The point is to make sure everyone understands which placements support the business and which ones create pressure.
Fill Rate and Time-to-Fill
Profitability is not only about pricing.
Speed matters too.
A recruiter who fills roles quickly can improve client satisfaction, reduce open order aging, and increase revenue velocity.
Key metrics may include:
Number of open orders worked
Number of roles filled
Fill rate
Average time-to-fill
Aging open orders
These metrics help owners see whether recruiters are producing efficiently or spending too much time on roles that are unlikely to close.
Slow fill speed can create hidden cost.
Recruiters spend time. Managers provide support. Clients lose confidence. Open roles stay on the board without producing revenue.
Retention or Fall-Off Rate
Not all placements are equally valuable.
A placement that falls off quickly can damage both profitability and client relationships.
For direct hire firms, fall-offs may create refund or replacement risk.
For staffing firms, early turnover can create extra work, lower client confidence, and reduce long-term account value.
A scorecard should track:
Fall-off rate
Average assignment length
Repeat issues by client
Repeat issues by role type
Retention helps separate short-term production from sustainable performance.
A recruiter who makes many placements but has a high fall-off rate may need coaching on candidate fit, expectation setting, or client qualification.
Client-Level Profitability by Recruiter
Recruiter performance is often tied to client quality.
A recruiter working with poor-fit clients may look less productive even if they are working hard.
That is why scorecards should include client-level visibility.
Useful client-level metrics include:
Revenue by client
Gross margin by client
Gross margin percentage by client
Payment behavior
Open order volume
Fill rate
Average assignment length
This helps owners avoid blaming recruiters for problems that are really client problems.
Sometimes the right decision is not “work harder.”
Sometimes the right decision is to renegotiate pricing, narrow the role types, improve intake, or stop prioritizing a client.
Cash Flow Impact
Profitability and cash flow are not the same thing.
A recruiter may produce profitable placements, but if those clients pay slowly, the firm may still feel cash pressure.
For staffing firms, this matters because payroll usually goes out before client payments come in.
A more advanced recruiter scorecard may include:
Revenue tied to slow-paying clients
Gross margin tied to slow-paying clients
Average days sales outstanding by recruiter’s book
Payroll exposure by client
This is especially useful when recruiters manage client relationships or influence which accounts receive priority.
It helps the firm see not only who is producing margin, but who is producing margin that converts into cash.
Why Incentives Can Accidentally Hurt Margins
Recruiter incentives shape behavior.
If incentives reward only revenue, recruiters may naturally focus on revenue.
That can lead to:
Discounting to win business
Accepting weak client terms
Prioritizing low-margin roles
Filling jobs quickly without enough attention to retention
Chasing volume that does not improve profit
This does not mean recruiters are doing anything wrong.
It means the incentive structure is telling them what matters.
If the firm wants better margin, the scorecard and incentive plan need to support that goal.
Better Incentive Structures for Recruiter Profitability
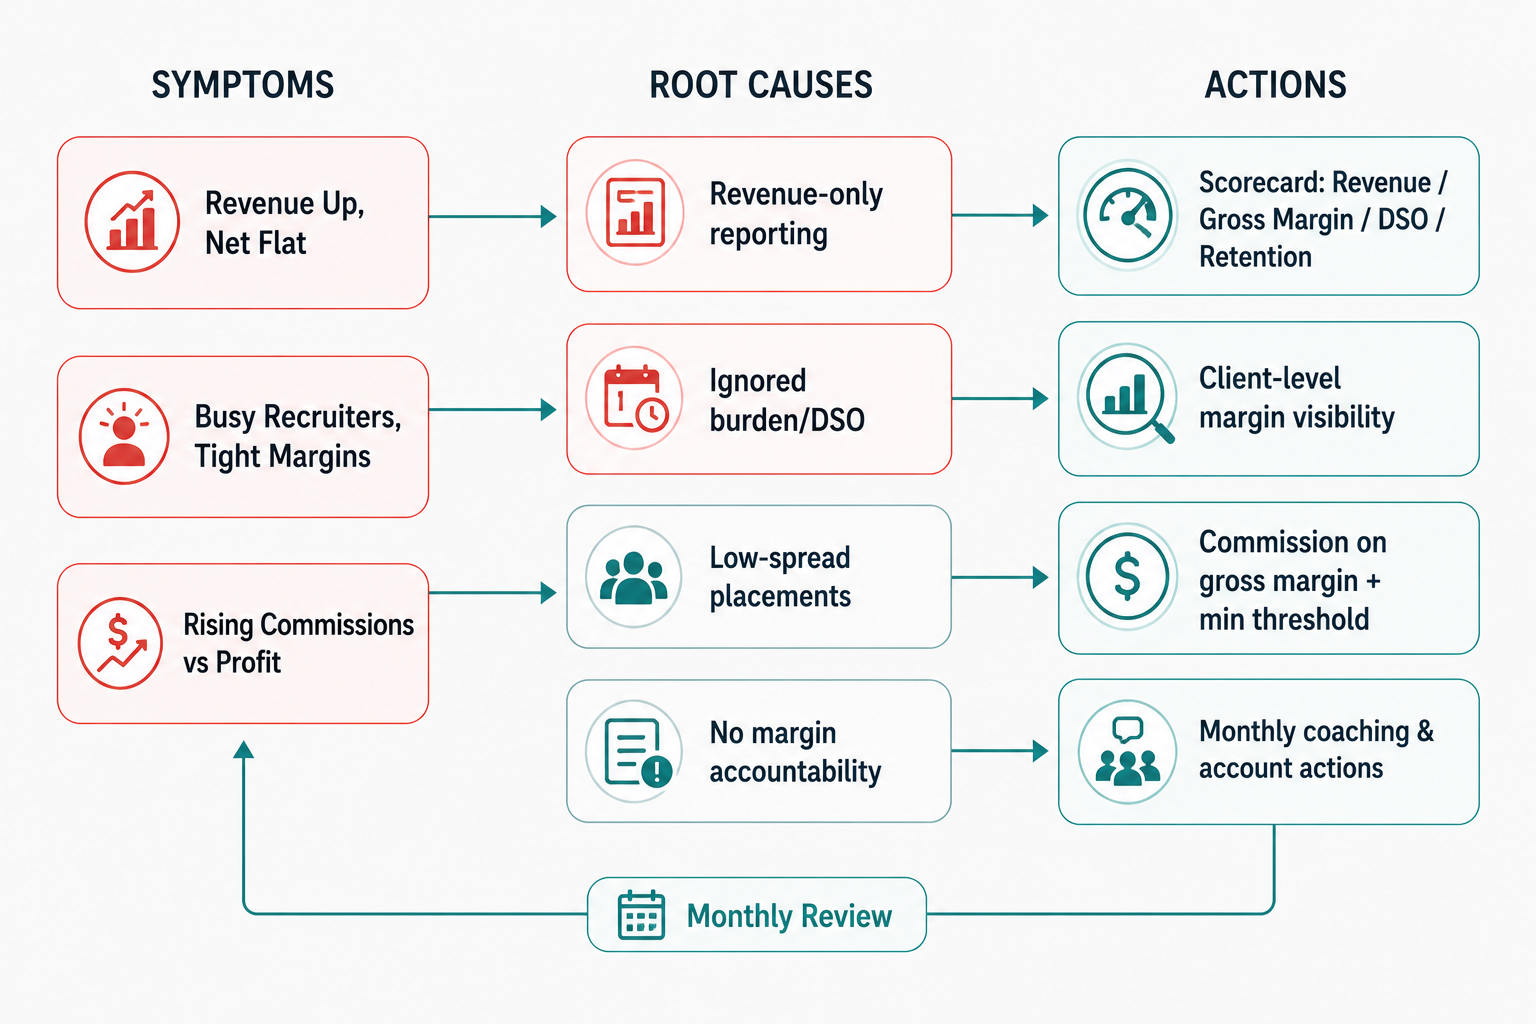
A stronger incentive plan usually balances production and profitability.
Instead of rewarding only revenue, staffing firms can consider incentives tied to:
Gross margin dollars
Gross margin percentage thresholds
Placement retention
Client profitability
Team profitability
Collection or payment quality, where appropriate
For example, a firm may pay commissions on gross margin instead of revenue.
That encourages recruiters to think about both production and pricing.
Another approach is to require a minimum margin threshold before full commission applies.
This can help prevent low-margin placements from being treated the same as healthy-margin placements.
The structure should be simple enough to understand. If recruiters cannot easily see how their behavior affects their compensation, the plan will not work well.
Reporting Mistakes to Avoid
A recruiter scorecard can be helpful, but only if the reporting is accurate and fair.
Common mistakes include:
Using revenue only
Ignoring burden costs
Comparing recruiters with very different books of business
Not separating temporary staffing from direct hire
Ignoring client payment behavior
Reporting too many metrics
Reviewing the scorecard inconsistently
The goal is not to build a complicated dashboard that nobody uses.
The goal is to create a clear view of recruiter performance that helps owners make better decisions.
What a Simple Recruiter Scorecard Might Include
A practical monthly scorecard may include:
Revenue
Gross margin dollars
Gross margin percentage
Number of placements or fills
Fill rate
Average time-to-fill
Fall-off or retention rate
Top clients by margin
Low-margin placements or clients
Notes on pricing, client quality, or operational issues
That is usually enough to start better conversations.
Over time, the scorecard can become more detailed. But the first version should be simple enough to review every month.
How Owners Should Use the Scorecard
The scorecard should not only be used to evaluate recruiters.
It should also be used to improve the business.
A good review process can help identify:
Recruiters who deserve more support
Clients that need pricing changes
Roles that consistently produce weak margins
Training needs around intake or negotiation
Incentives that are encouraging the wrong behavior
Accounts that look good on revenue but weak on profit
The best scorecards lead to better decisions, not just more reporting.
Warning Signs Your Recruiter Reporting Is Missing Profitability
Recruiter profitability issues usually show up indirectly first.
Common warning signs include:
Top-line revenue is growing, but net income is flat
Recruiters are busy, but margins feel tight
Owners cannot tell which recruiters are most profitable
Commission expense rises faster than firm profitability
Low-margin clients keep getting priority
Placement volume improves, but cash flow does not
If these feel familiar, the firm may not have a recruiter performance problem.
It may have a visibility problem.
What to Do Before Changing Compensation
Many owners jump straight to changing commissions.
That may be necessary, but it should not be the first step.
Before changing incentives, staffing firm owners should understand:
Gross margin by recruiter
Gross margin by client
Margin by placement type
Fall-off rates
Client payment behavior
Current commission cost by recruiter
Without that clarity, compensation changes can create confusion or frustration.
Recruiters need to trust the numbers before they are expected to change behavior based on them.
Final Thought
Recruiter profitability scorecards are not about turning people into spreadsheets.
They are about giving staffing firm owners a clearer view of what is actually driving margin.
Revenue matters. Activity matters. Placements matter.
But if those numbers are not connected to gross margin, retention, client quality, and cash flow, the firm may be rewarding growth that does not improve the business.
The right scorecard helps owners see which recruiters, clients, and roles are creating profitable growth and which ones need attention.
In our Accounting Review, we help staffing and recruiting firm owners break down profitability by recruiter, client, and placement type so they can make better decisions around reporting, incentives, and margin improvement.